nLab statistical significance
Context
Measure and probability theory
Measure theory
Probability theory
Information geometry
Thermodynamics
Theorems
Applications
Contents
Idea
The statistical significance of a measurement outcome of some variable is a measure of how unlikely it is that this outcome would be observed if were a random variable under given default assumptions, the latter often called the “standard model” or the “null hypothesis” and denoted . Hence
-
a low statistical significance of the observed value suggests that the default assumptions, hence the “standard model” or the “null hypothesis”, is correct, whence is then also called a null result;
-
a high statistical significance of the observed value suggests that the default assumptions, hence the “standard model” or the “null hypothesis”, might be inaccurate and hence “to be rejected”, or, rather, to be replaced by an improved assumption/model/hypothesis under which the observation becomes implied with higher probability.

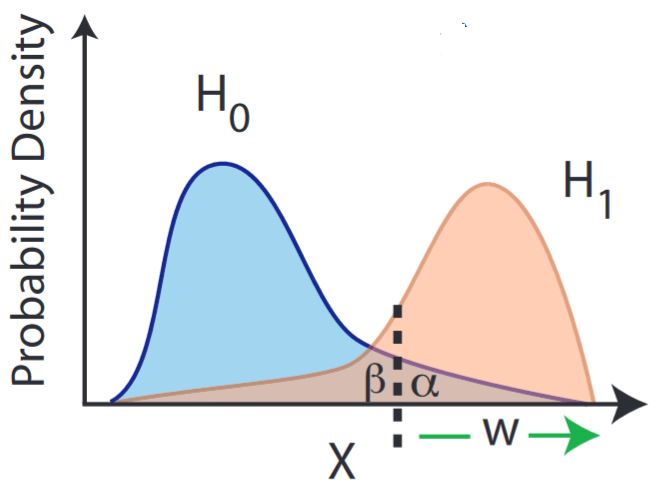
More precisely, in general statistical significance is given as the probability that a random variable with values in the real numbers takes a value in the interval of values equal or greater the observed value . This probability is known as the p-value. The lower this probability, the higher the statistical significance of observing .
graphics grabbed from Sinervo 02

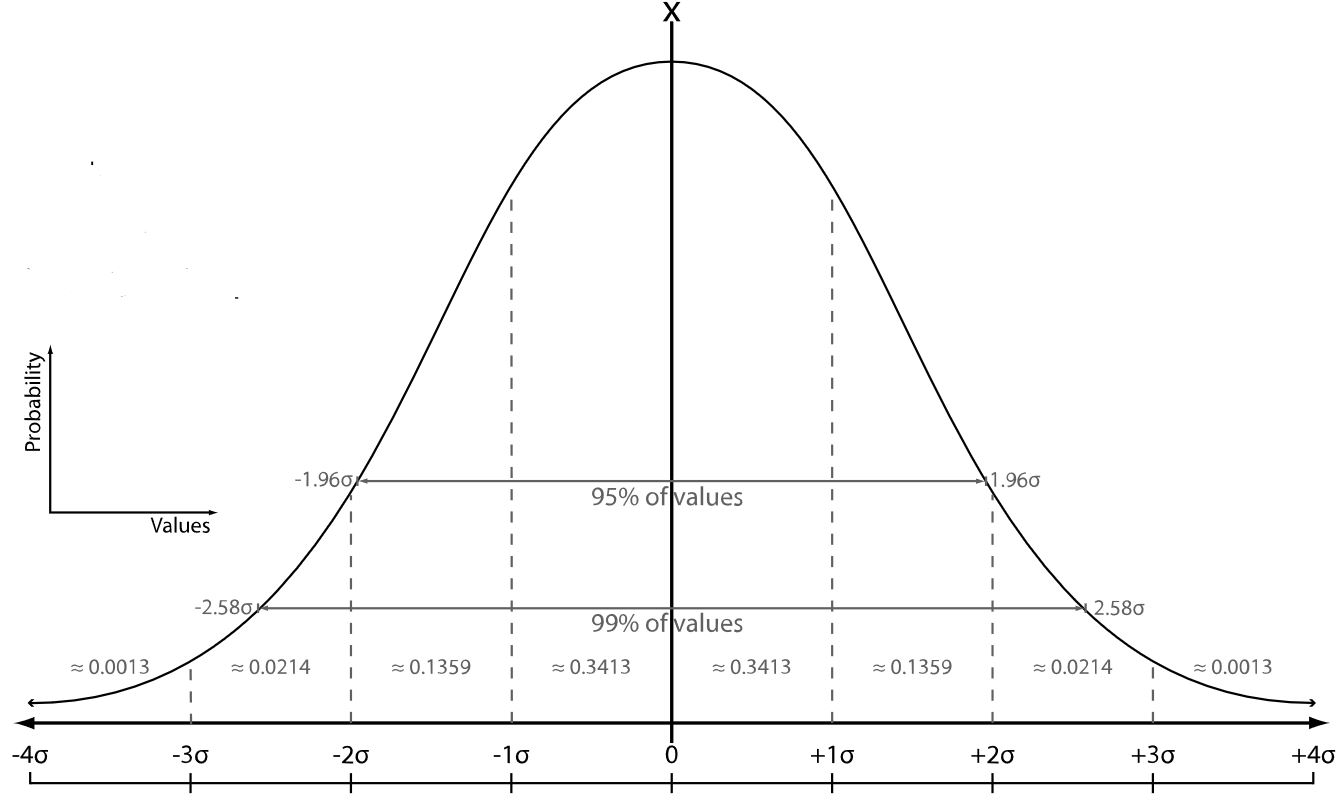
In the special, but, by the central limit theorem, generic situation that the probability distribution of under hypothesis is a normal distribution, it follows that the probability is a monotone decreasing function of , so that the value of itself is a measure of its statistical significance – the larger , the larger its statistical significance, in this case. It is natural then to express the magnitude in units of standard deviations of the given normal distribution . This expression of statistical significances in terms of standard deviations is common in particle physics (e.g. Sinervo 02), see below.
As with much of statistics, the concept of statistical significance is mostly used at the interface between theory and experiment, hence is part of the process of coordination, and as such subject to subtleties of real world activity that are not manifest in its clean mathematical definition. Often policy making and/or financial decisions depend on estimating and interpreting statistical significances. This has led to some lively debate about their use and misuse, see below for more. As a general rule of life, for a mathematical result to work well in applications, you need to understand what it says and what it does not say. There has also been considerable debate between Bayesian and frequentist statisticians as to cogency of the use of statistical significance, see below.
Origin of significance threshold
The threshold seems to date back to (Fisher 1926)
… it is convenient to draw the line at about the level at which we can say: “Either there is something in the treatment, or a coincidence has occurred such as does not occur more than once in twenty trials.”…
If one in twenty does not seem high enough odds, we may, if we prefer it, draw the line at one in fifty (the 2 per cent point), or one in a hundred (the 1 per cent point). Personally, the writer prefers to set a low standard of significance at the 5 per cent point, and ignore entirely all results which fail to reach this level. A scientific fact should be regarded as experimentally established only if a properly designed experiment rarely fails to give this level of significance.
This last sentence—implicitly about experimental replication—is often conveniently forgotten by researchers with only a rough working knowledge statistics, whereby a single -value under is seen as a discovery, rather than merely evidence.
In particle physics
In particle physics, it has become customary to require statistical significance levels of (5 standard deviations) in order to claim that a given observation is a real effect (e.g. Sinervo 02, Section 5.3, Dorigo 15, Section 3). This corresponds to a probability (p-value) of about
that the observation is a random fluctuation under the null hypothesis.
Notice that this is rather more stringent than the p-value of , corresponding to , which has been much used and much criticized in other areas of science, see below.
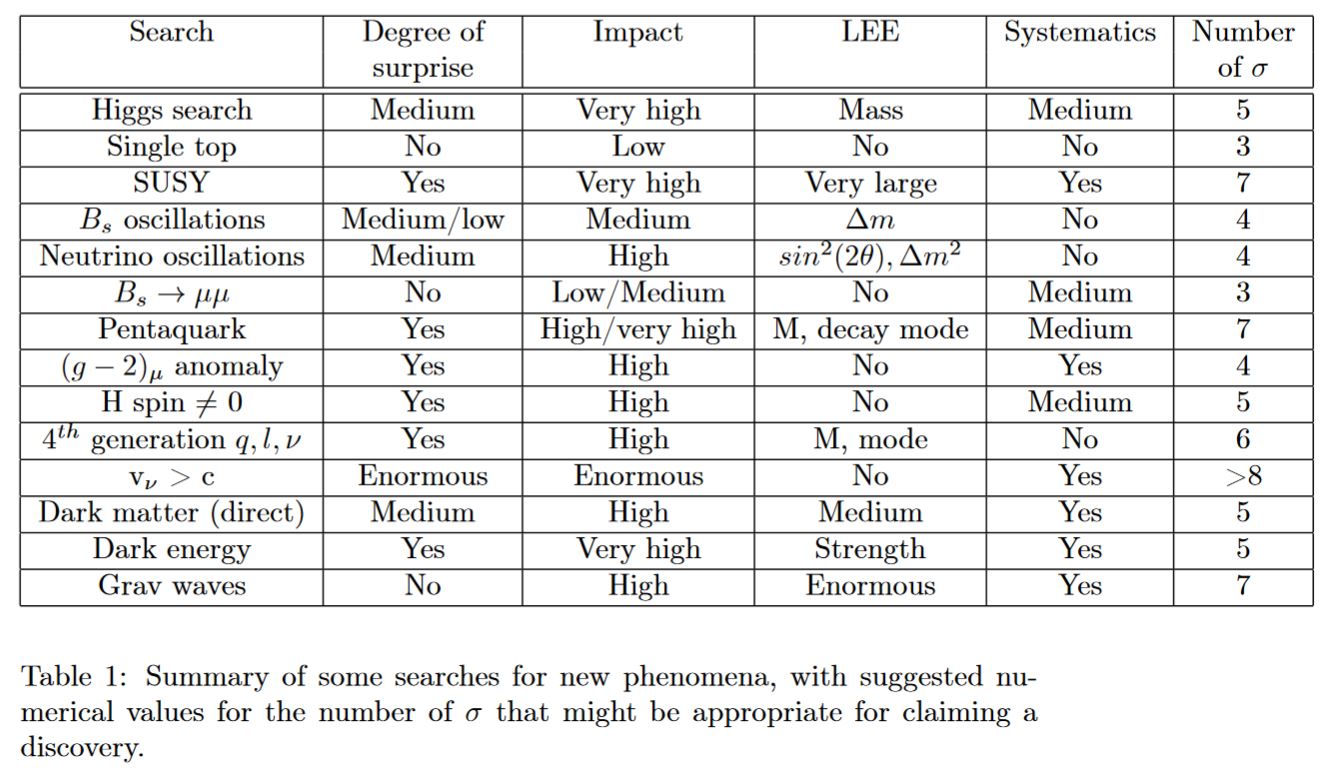
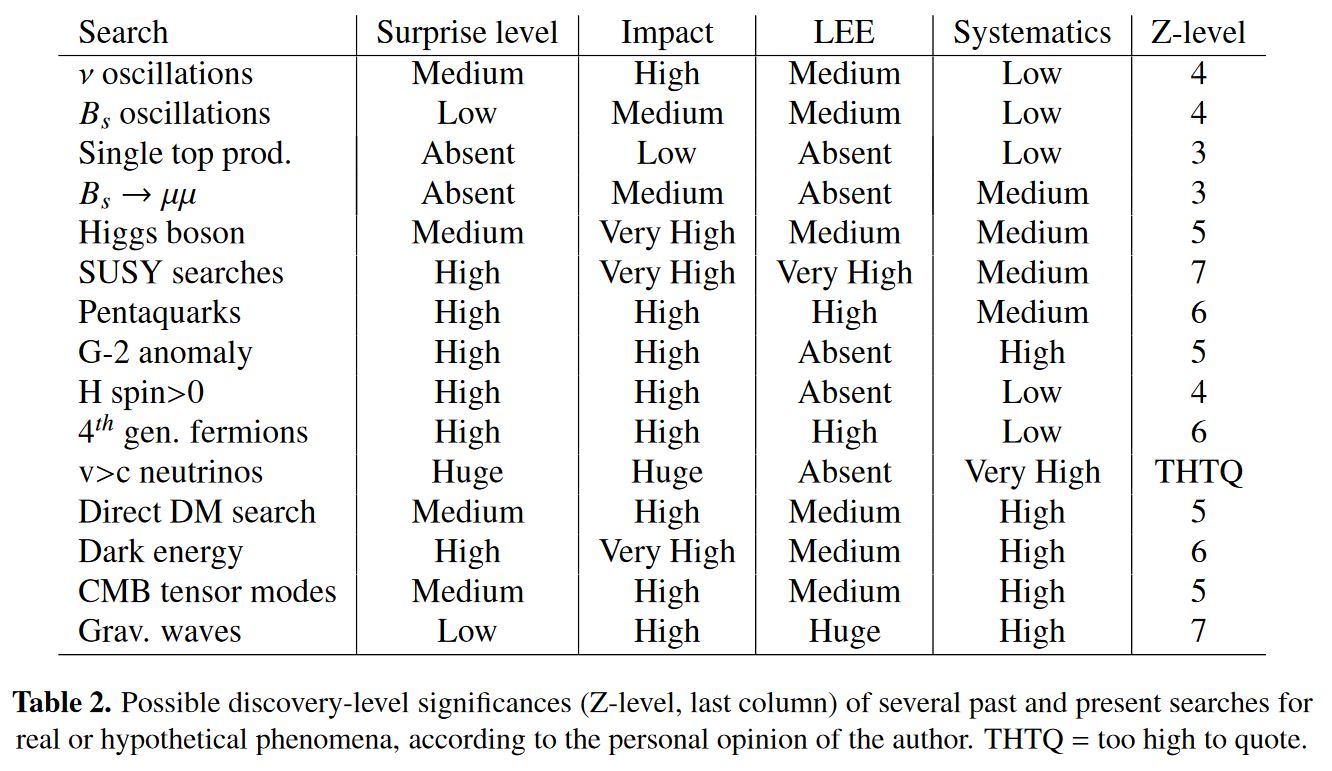
Of course the -criterion for detectoin is a convention as any other. It has been argued in Lyons 13b, Dorigo 15 that different detection-thresholds should be used for different experiments. These suggestions are subjective and not generally agreed on either:

table taken from Lyons 13b, p. 4

table taken from Dorigo 15, p. 16
Regarding effects of current interest, notice that
-
the significance for anomalies in the anomalous magnetic moment of the muon required by Lyons 13b, p. 4 has been reached by summer 2018, see there;
-
the significance for flavour anomalies in B meson decays required both by Lyons 13b, p. 4 and by Dorigo 15, p. 16 has also been much exceeded by summer 2018, see there.
In other sciences
In pharmacology, for instance, hypothesis testing at some significance level is used in drug trials. Where those taking drug fare on average better than those on drug , one might calculate the likelihood that such an effect would be found by chance given that the two drugs were in fact equally effective.
Possible misuse
There have been a number of criticisms of the uses to which -values have been put in scientific practice (e.g., ZilMcCl 08, GSRCPGA 16). The American Statistical Association has published a statement on -values (WassLaz 16), claiming that
the widespread use of ‘statistical significance’ (generally interpreted as ‘’) as a license for making a claim of a scientific finding (or implied truth) leads to considerable distortion of the scientific process.
Frequentist versus Bayesian statistics
On a more fundamental level, Bayesian statisticians have taken issue with the frequentist practice of hypothesis testing (see, e.g., Jaynes 03, sec 9.1.1, D’Agostini 03), arguing that the value that should be sought is the probability of a proposed hypothesis conditional on the data, rather than the probability of the data under some null hypothesis. The frequentist concept of probability cannot allow for such a thing as a hypothesis having a probability.
A useful comparison of the frequentist and Bayesian approaches as employed in particle physics, and a call for their reconciliation, is in (Lyons 13a):
for physics analyses at the CERN’s LHC, the aim is, at least for determining parameters and setting upper limits in searches for various new phenomena, to use both approaches; similar answers would strengthen confidence in the results, while differences suggest the need to understand them in terms of the somewhat different questions that the two approaches are asking. It thus seems that the old war between the two methodologies is subsiding, and that they can hopefully live together in fruitful cooperation.
Related concepts
References
One early discussion is in
- RA Fisher, The Arrangement of Field Experiments, Journal of the Ministry of Agriculture of Great Britain 33 (1926) pp 503–513.
Review includes
-
Pekka K. Sinervo, Signal Significance in Particle Physics, in Proceedings of Advanced Statistical Techniques in Particle Physics Durham, UK, March 18-22, 2002 (arXiv:hep-ex/0208005, spire:601052)
-
Edwin Jaynes, Probability theory: The logic of science, Cambridge University Press, 2003.
-
Louis Lyons, Bayes and Frequentism: a Particle Physicist’s perspective, Journal of Contemporary Physics Volume 54, 2013 - Issue 1
-
Louis Lyons, Discovering the Significance of 5 sigma (arXiv:1310.1284)
-
Tommaso Dorigo, Extraordinary claims: the solution, EPJ Web of Conferences 95, 02003 (2015) (doi:10.1051/epjconf/20159502003)
-
Roger John Barlow, Practical Statistics for Particle Physics (arXiv:1905.12362)
See also
-
Wikipedia, Statistical significance
-
Leland Wilkinson and Task Force on Statistical Inference, Statistical methods in psychology journals: guidelines and explanations, American Psychologist 54 (1999), 594–604, pdf
Cautionary remarks on misuse of the concept include the following
-
Stephen Ziliak and Deirdre McCloskey, The Cult of Statistical Significance, Michegan University Press, 2008, book.
-
Giulio D’Agostini, Bayesian reasoning in data analysis: A critical introduction, World Scientific Publishing, 2003.
-
Cafe: Fetishizing p-Values by Tom Leinster
-
Greenland, Senn, Rothman, Carlin, Poole, Goodman, Altman, Statistical tests, P values, confidence intervals, and power: a guide to misinterpretations, Eur J Epidemiol. 2016 Apr;31(4):337-50. (doi:10.1007/s10654-016-0149-3)
-
Ronald Wasserstein, Nicole Lazar, The ASA’s Statement on -Values: Context, Process, and Purpose, The American Statistician 70(2), 2016, pp. 129-133 (doi:10.1080/00031305.2016.1154108)
Last revised on January 13, 2023 at 10:02:23. See the history of this page for a list of all contributions to it.